


Question 1- What is Data Science?
Answer- Data Science is a multidisciplinary way to deal with extricating significant data from the huge and steadily expanding volumes of information gathered and made by the present organizations.
It uses scientific methods, processes, and algorithms to extract meaningful information from structured and unstructured data.
Data science uses statistics, data analytics, informatics, and their related methods to understand the actual phenomena with data.
Question 2- Differentiate between supervised and unsupervised learning.
Answer- Supervised learning- supervised learning is a type of machine learning where we train the machine with some data which is already tagged with correct answers that is, the labeled data.
Unsupervised learning- unsupervised learning is a type of machine learning where the machine is not trained with labeled data and algorithms are allowed to act on information without any guidance.
Following are the differences between supervised and unsupervised learning-
|
Supervised learning |
Unsupervised learning |
|
Uses labeled input datasets |
Uses unlabeled input datasets |
|
Highly accurate |
Less accurate |
|
Presence of a supervisor as a teacher |
No presence of a supervisor |
|
Collects data and produces data output based on previous experiences |
Works based on similarities, patterns, and differences without any prior knowledge or experiences. |
|
Computationally less complex |
Computationally complex |
|
Algorithms used- Decision Tree, K-nearest neighbor algorithm, Neural Networks, Regression, and Support Vector Machine |
Algorithms used- Anomaly Detection, clustering, Latent Variable Models, and Neural Networks |
|
Used for prediction |
Used for analysis |
Question 3- Explain selection bias?
Answer– Selection bias means the selection of individuals, groups, or data for analysis in a way that proper randomization is not accomplished.
It happens when the participants in the group are not similarly selected for experimental and control groups.
It is an experimental error that happens when the participants or the resulting data are not representative of the target population. It is sometimes also known as the selection effect.
Selection bias is of the following types-
- Sampling bias- Sampling bias also known as sample selection bias occurs when people participating in the research are not chosen randomly by the researchers.
- Time Interval- it refers to the early termination of a trial when its result supports the desired outcome.
- Data- dividing data with the knowledge of partitions content, and then analyzing them with tests designed for blindly chosen partitions.
- Studies- selection of studies to be included in the meta-analysis.
- Attrition- It is a type of bias caused by the loss of participants.
- Volunteer bias- in self-selection bias or volunteer bias the participants may have intrinsically different characteristics from the target population of the study.
Question 4- What is a confusion matrix?
Answer- Confusion matrix is a way of assessing the performance of a classification model. It is a comparison between the actual value and the predicted value. It is useful in the supervised learning category using labeled data sets.
The confusion matrix is represented by a positive and a negative class. In this table, there are four different combinations of predicted and actual values.

- True Positive(TP)- an outcome where the model correctly predicts the positive class.
- True Negative(TN)– an outcome where the model correctly predicts the negative class.
- False Positive(FP)– an outcome where the model incorrectly predicts the positive class.
- False Negative(FN)– an outcome where the model incorrectly predicts the negative class.
The confusion matrix helps in improving the performance of machine learning classification models.
Question5- What do you understand by true positive rate and false positive rate?
Answer- True positive rate- It is the probability that actual positive will test positive. It measures the percentage of the actual positives that are correctly identified. In machine learning, it is also referred to as sensitivity or recall.
True positive rate(TPR) can be calculated as:
TPR=TP/TP+FN
False positive rate- It is the measure of false positives against all positive predictions.
The false positive rate can be calculated as:
FPR=FP/TP+FP
Question 6- Draw a comparison between overfitting and underfitting.
Answer- The main goal of each machine learning model is to produce reliable and accurate output which is called generalization. Hence, overfitting and underfitting are the two terms that need to be checked to evaluate the performance of any machine learning model.
These are two main problems that happen in machine learning and deteriorate the performance of the machine learning models.
Differences between overfitting and underfitting-
|
Overfitting |
Underfitting |
|
The machine learning model tries to cover all or even extra data points present in given datasets. |
The model is unable to capture the data points present in the datasets. |
|
Starts caching noises and inaccurate values present in the datasets |
It cannot find the best fit of the dominant trend in data. |
|
It has low bias and high variance. |
It has high bias and low variance. |
Question 7- Explain the role of data cleaning in data analysis.
Answer- Data cleaning is the process of fixing or removing incorrect, duplicated, inaccurate, irrelevant, corrupted, or incomplete data within a dataset.
It is used to make sure that the data is correctly formatted and conforms to the set of rules. It helps in increasing the overall performance and allows the highest quality information.
Question 8- What do you mean by cluster sampling and systematic sampling?
Answer- Cluster sampling- In this process, the researchers divide the population into small groups known as clusters. They then randomly select among these groups to form samples. It is used to study large populations which are widely geographically dispersed.
Systematic sampling- In this, the researchers choose the sample members of the population at regular intervals. It requires a starting point for the samples and the sample size should repeat at regular intervals.
Question 9- What is Natural Language Processing? Give some real-life examples of NLP.
Answer- Natural language processing is a subfield of Artificial Intelligence concerned with interactions between human language and computers. Through this language, computers learn to process and analyze natural language data.
NLP has many real-life examples like chatbots, google translators, virtual assistants like Alexa, or Siri on our smartphones, etc.
Question 10- What do you mean by regularization? Explain L1 and L2 regularization.
Answer- Regularization is the technique to further develop your model which is overfitted by introducing extra terms in the loss function. This helps in improving the model’s performance better for unseen data.
There are two types of regularizations-
L1 Regularization- It is also called Lasso regression. It adds the “absolute value of magnitude” of coefficient as a penalty term to the loss function.
L2 Regularization- It is also called Ridge regression. It adds “squared magnitude” of coefficient as a penalty term to the loss function.
Question 11- What is a decision tree algorithm?
Answer- The decision tree algorithm is a type of supervised machine learning. In this, tree representation is used to solve the problem. The leaf nodes represent a class label and internal nodes represent attributes.
The goal of this algorithm is to predict the value of a target variable.

Question 12- What do you mean by linear regression and logistic regression?
Answer- Linear regression is used to predict the value of one variable(predicted variable) based on the value of another variable(predictor variable). There are two types of linear regression- simple and multiple.
Logistic regression- It is a statistical analysis model which predicts a data value based on prior observations on data sets.
Question 13- What do you understand about Eigenvalues and Eigenvectors?
Answer- The equation is Ax=ƛx, the number ƛ is the eigenvalue of A
The eigenvalue ƛ tells whether the special vector x is stretched or shrunk or reversed or left unchanged when it is multiplied by x.
Almost all vectors change direction when multiplied with A. There are certain vectors that do not change direction and remain in the same direction as Ax, they are called eigenvectors.
Question 14- List some practical applications of Data Science?
Answer- In data science, the data is organized in a very efficient way. Some applications of data science are-
- Powerful and precise healthcare tools were developed in the past which are powered by data science. Eg- ONCORA MEDICAL
- UPS- UPS uses data science to optimize the route of transport from drop-off to delivery.
- Banks use data science to manage their resources efficiently.
- Data science is used in business analytics, business logistics, and supply chain management.
- Machine learning models can make predictions on the input data and identify whether the email is spam or not.
Question 15- What is the difference between data science and data analytics?
Answer-
| Data Science | Data Analytics |
| Focuses on machine learning and predictive modeling | Focuses on viewing the historical data in the context |
| Find correlation between large datasets | Focus on specific answers to questions that data science brings forth |
| Works on raw and structured datasets | Woks on existing datasets |
Question 16- What do you understand by Deep learning?
Answer- Deep learning is also called deep structured learning. It is a part of machine learning models and artificial neural networks. It utilizes various layers to extract higher-level features from the raw input. In this learning, each level changes the input data into a more abstract and composite representation.
Question 17- Name various types of Deep learning frameworks.
Answer- The most popular deep learning frameworks are-
- Microsoft cognitive toolkit
- Pytorch
- Chainer
- Tensorflow
- Caffe
- Keras
Question 18- Explain A/B testing.
Answer- A/B testing is a way of comparing two versions of a variable to find out which performs better in a controlled environment.
For example, you own a company and divide the products into two categories A and B. You keep A unchanged and make a few changes to B. Now, based on the response from the customers you try to decide which product is performing better.

If we consider the above diagram, the response on product B is more. So that means the product with some variance is performing better than the product we kept unchanged or controlled.
Question 19- What is dimensionality reduction?
Answer- Dimensionality reduction refers to reducing the dataset with a high number of dimensions into a dataset with a lower number of dimensions. It helps in reducing time and storage space. This is done by dropping some fields or columns from the datasets.
Question 20- What is bias in data science?
Answer- Bias in data science refers to some error in the data. Bias is a deviation from the expectation in data. It is the amount that the model’s prediction differs from the actual value. This error happens when the information is excessively complicated for the calculation, so it winds up building a model that simplifies assumptions.
Linear regression and Logistic regression algorithms can lead to high bias.
Question 21-What is RNN(Recurrent Neural Networks)?
Answer- Recurrent neural networks are the neural networks where the output from the previous step is fed as input to the current step. In RNN, a directed graph is formed by the connections between the nodes along a temporal sequence. Sequence data can be modelled using these models.
The RNN is mostly used for speech recognition and natural language processing.

Question 22 – Explain Variance and Covariance. How would you calculate them?
Answer- Variance- Variance is used to calculate how far each number in the data set is from the mean.
variance=0, means all values within the dataset are identical.
A larger value of variance means the values are far away from the mean and each other whereas, a low variance value means the values are close to each other.
The formula for Variance-

x= individual data point
u= mean of data points
N=total number of data points
Covariance- It measures the degree to which two variables are linearly associated. Covariance is the measure of how changes in one variable are related to changes in the second variable.

Question 23- What is gradient descent?
Answer- Gradient descent is an optimization algorithm used to find the values of parameters (coefficients) of a function (f) that minimizes a cost function (cost). It is used to find the value of a function’s coefficients that minimize a cost function as far as possible.
Question 24- Explain hypothesis testing in data science.
Answer- In Hypothesis testing, we test the assumptions made regarding a population parameter. The test concludes which assumptions best reflect the sample data. It is generally used when we need to compare a single group to external standards.
The main purpose of hypothesis testing is to test whether the null hypothesis can be rejected or accepted.
Question 25- What is a p-value? How will you calculate the p-value?
Answer- The p-value, or probability value, is the probability of finding the observed results when the null hypothesis is true. The p-value helps in determining the strength of the result. The value can range from 0 to 1.
Low p-value(≤0.05), reject the null hypothesis. It means strength against the null hypothesis.
High p-value(≥0.05), accept the null hypothesis. It means strength for the null hypothesis.
the p-value=0.05, null hypothesis can go anyway.
Question 26- How do you find RMSE and MSE in a linear regression model?
Answer- Root Mean Square Error(RMSE)- It is the standard deviation of the residuals(prediction errors). Residuals are a measure of how far the data points are from the regression line. RMSE measures how much these residuals are spread out.
It tells you how concentrated the data is from the best fit line.

Mean Square Error(MSE)- MSE is the average squared difference between the estimated values and what is estimated.

Question 27- What is the difference between boxplot and histogram?
Answer- Boxplot and histogram are graphical representations of the frequency of the numeric data values.
|
Boxplot |
Histogram |
|
It represents the five most important descriptive values of a dataset |
Displays frequencies for a group of data |
|
It attempts but is not able to give a good picture of the distribution of variables |
Gives a good sense of the distribution of variables |
|
Allows to compare multiple datasets better than histogram |
Better in evaluating the underlying distribution of data |
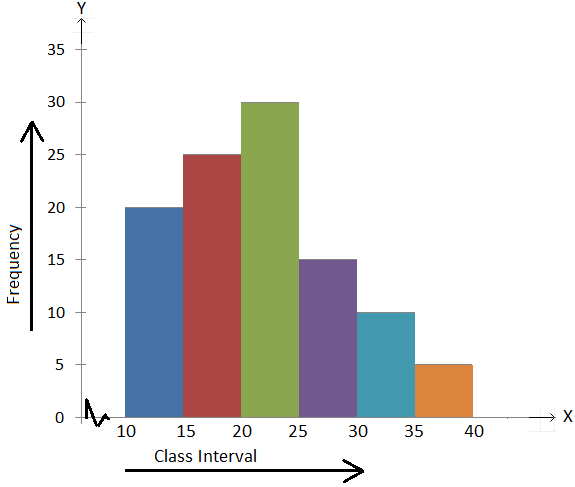
Histogram

Boxplot
Question 28- Difference between “wide” and “long” format data?
Answer- Wide-format data-
- There is one record for each individual.
- Observations taken at different times are coded as different columns.
- There is no redundancy or repetition in wide format.
Sample of wide format data-
|
Id |
Age |
Y1 |
Y2 |
Y3 |
|
1 |
14 |
21 |
22 |
… |
|
2 |
12 |
8 |
9 |
… |
|
3 |
15 |
23 |
25 |
… |
Long format data-
- There are multiple records for each individual.
- Some variables may be identical and some may vary.
- Better in handling irregular and missed visits.
Sample of long format data-
|
Id |
Age |
Y |
|
1 |
14 |
21 |
|
1 |
14 |
22 |
|
2 |
12 |
8 |
|
2 |
12 |
9 |
Question 29- Differentiate between univariate, bivariate, and multivariate analysis.
Answer- Univariate analysis is the analysis of one variable
Bivariate analysis is the analysis of exactly two variables and their relationship.
Multivariate analysis is the analysis of multiple variables and their relationship.
Question 30- What is the AUC-ROC curve?
Answer- ROC curve is Receiver Operating Characteristics Curve. This graph shows the performance of the classification model at every classification threshold.
This curve has two parameters- true positive rate and false positive rate. It measures the performance of classification problems.
AUC is Area Under Curve, it represents the degree of separability between classes. Higher AUC means the model is better at predicting the separability, i.e. predicting 0 classes as 0 and 1 classes as 1.
AUC near 1= good measure of separability= excellent model
AUC near 0=poor measure of separability= poor model
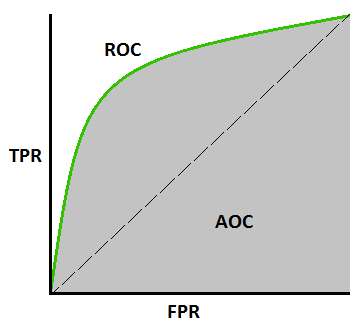
Graphical representation of AUC-ROC curve
Question 31- Assume there is a dataset having variables with missing values of more than 30%, how might you manage that dataset?
Answer- Depending upon the size of the dataset, the following steps are used to manage the dataset with missing values-
- In the case of larger datasets, the rows with missing values can be deleted and the remaining data can be used for data prediction.
- In the case of small datasets, the missing values are substituted with the mean or average value of the remaining data.
In pandas, this is done using the formula- mean=df.mean()
df= pandas data frame that represents the dataset
mean= mean of the data
Question 32- What is the difference between the test set and the validation set?
Answer- Test set- Test set is used to test the performance of a trained model. It is not used in the model building process.
Validation set- It can be regarded as part of the training set because it is used to build models. It is used in parameter selection and to avoid overfitting.
Question 33- What is the importance of statistics in data science?
Answer- Statistics plays an important role in understanding data. The huge amount of data can be represented in a precise and definite form. Statistics helps in collecting correct data.
It is utilized to handle complex issues in reality with the goal that information researchers and investigators can search for significant patterns and changes in Data.
Question 34- What is the difference between squared error and absolute error?
Answer- Squared error measures the average of the squares of error. It is the average squared difference between the actual and the estimated values.
Absolute error is the difference between the measured value and the actual value.
Question 35- What is market basket analysis?
Answer- Market basket analysis is a data mining technique used by retailers. It is used to understand customer purchasing patterns and helps in increasing sales.
It analyzes large datasets such as purchase history, products likely to be purchased together, etc.
This is a key technique used by large retailers like Amazon and Flipkart to understand their customers’ purchasing patterns.
Question 36- What is API? What are APIs used for?
Answer- API stands for Application Programming Interface. It is an intermediary software that allows two applications to talk to each other. It is an interface between two software.
Every application used on the phone uses an API to access and deliver information.
Question 37- Which language is best for data analytics? R or python?
Answer- R is good for creating graphics and data visualizations. If you want statistical analysis and data visualization portions of data analysis then R could be a good fit.
Python is better at handling huge amounts of data. If you want to work with big data, artificial intelligence, and deep learning algorithms then python is a good choice.
Question 38- What is binomial distribution?
Answer- The binomial distribution is the probability of only two outcomes: success or failure in an experiment repeated several times.
The binomial distribution has the following properties-
- The experiment consists of n number of identical trials.
- Each trial comes out with two outcomes either success S or failure F.
- The probability of success on a single trial is equal to p.
Formula-

Question 39- Can you stack two series horizontally? If yes, how will you do it?
Answer- Yes, two series can be stacked horizontally by using concat() function and setting axis=1
df=pd.concat([s1,s2],axis=1)
Question 40- Will treating a categorical variable as a continuous variable result in a better predictive model?
Answer- A categorical variable can be treated as a continuous variable only if the variable is ordinal in nature. It results in a better predictive model.
Question 41- List some libraries used in Python for data analysis.
Answer-
- Pandas
- Numpy
- Scipy
- Seaborn
- Tensorflow
- Keras
Question 42- What is Pytorch?
Answer- Pytorch is an open-source machine learning library developed by Facebook’s AI Research lab. It is used for computer vision and natural language processing applications.
It has dynamic computational graphs, that means the network’s behavior can be changed programmatically during runtime.
Question 43- Explain the Boltzmann machine?
Answer- A Boltzmann machine is a type of stochastic recurrent neural network. It is a network of symmetrically connected units that make decisions about whether to be on or off. It is used to optimize the solution of a problem. It optimizes the weight and quantity of that particular problem.
Question 44- What packages are used for Data mining in Python and R?
Answer- Python- Numpy, Matplotlib, Pandas, Scikit learn, Seaborn
R- ggplot2, data.table, dplyr, Shiny, plotly, mlr3
Question 45- What is bias-variance trade-off?
Answer- Bias is the error in the data. Variance is used to calculate how far is each number in the dataset from the mean.
Bias-Variance tradeoff means that the variance across the estimated parameters can be reduced by increasing the bias in the estimated parameters across samples.

High variance focuses on training data. These models perform very well. High bias does not focus on training data and leads to training and test data errors.
Question 46- List some of the important tools used in Big Data analytics.
Answer- Some important tools used in Big Data analytics are-
- Tableau Public
- OpenRefine
- KNIME
- RapidMiner
- NodeXL
- Wolfram Alpha
Question 47- What is pattern recognition?
Answer- Pattern Recognition is a data analysis method. It is an automated recognition of different patterns by using machine learning algorithms. Data can be text, images, sounds, etc.
Question 48- List some areas where pattern recognition is used.
Answer- Pattern Recognition has a wide scope in several fields-
- Image analysis
- Information retrieval
- Signal processing
- Statistical data analysis
- Bioinformatics
- Data compression
- Computer graphics
Question 49- What is precision?
Answer- Precision means exactness. It measures how many observations made by our model are correctly predicted over the amount of correct and incorrect predictions. It ranges from 0 to 1. 1 means 100% precise.
Question 50- Why is python more preferable over other programming languages?
Answer- Due to the following reasons Python is preferred more over other languages-
- It is open-source software, that is it is free of cost.
- Python has a very simple syntax, it needs less coding than others.
- All types of businesses, small or large, can afford it.
- It has vast data science libraries.
- It is fast, easy to learn, and read.
Conclusion

Here I have enumerated 50 data science interview questions and answers. Hope they will be useful for anyone going for the post of a data scientist.
FAQs
Answer- Data science is in great demand due to the following reasons-
Handles big and unstructured data.
Availability of AI.
Increase in computation capacity
New technologies for data storage
Answer- There are many data science courses available but if you want to learn the best you can opt for the Henry Harvin Data Science Course.
Henry Harvin ranks amongst the top 5 upskilling courses in India. This course equips you with the most fundamental skills expected to apply data science in any real-world context.
If you want in-depth knowledge of Data Science you can enroll yourself with the Henry Harvin Data Science Course.
Answer- Data science exists everywhere. The scope of data science is becoming vast day by day. With its technological developments, scope of data science has increased drastically.


Recent Comments